Playing with fire: A beginner's guide to fire data
(This post is also published on Landscape Detectives: Critical Physical Geography at Lund University)
Climate change and its impacts are making pyrogeography a hot topic. To monitor wildfire in a remote area, or to understand fire regime in regional or global scale, we need reliable fire data for better fire prevention and suppression efforts. However, depending on your purposes, such as spatial urgency or temporal scale, there are different fire data products for you to choose from. Vegetation fires typically ignite and burn for less than a day or just a few days before extinguishing, which means that having frequent satellite passes is important for detecting fire activity. Therefore, both temporal and spatial resolution are important for fire assessment. To avoid burnout from data selection, in this post, I am going to guide you on how to navigate between different satellite-based fire products and how to choose from them.
In this article, we will talk about different types of fire datasets, including active fire, burned area, and fire index data.
What is active fire?
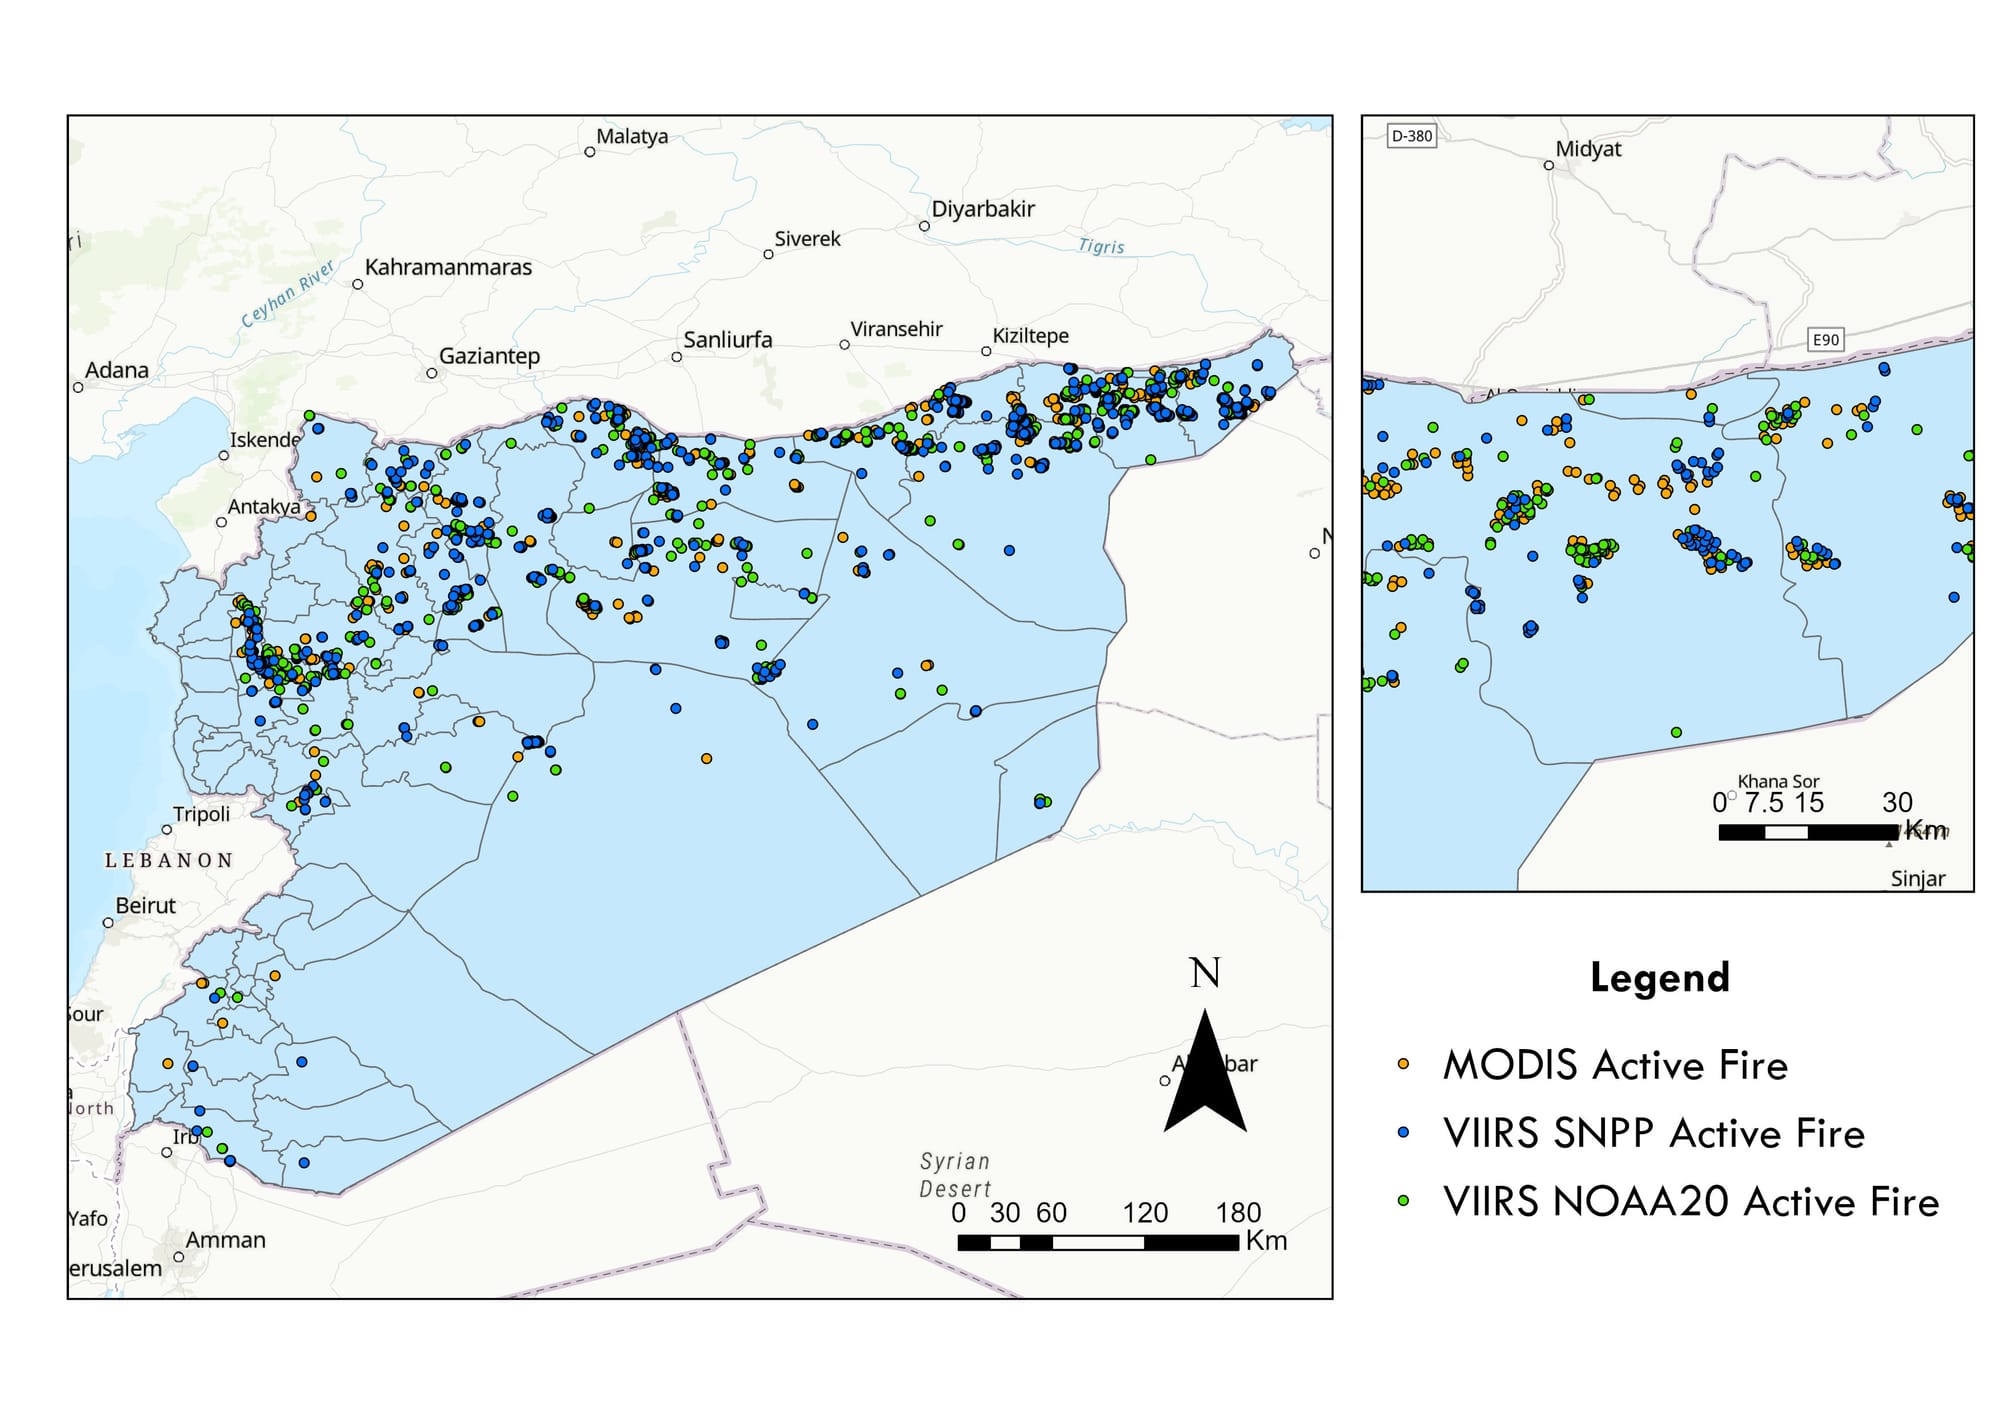
Active fire refers to fire occurrence data to document the location point of the fire event. Currently we have two types of active fire data, which are also commonly used in fire studies – Moderate Resolution Imaging Spectroradiometer (MODIS) active fire data and Visible Infrared Imaging Radiometer Suite (VIIRS) active fire data.
MODIS active fire
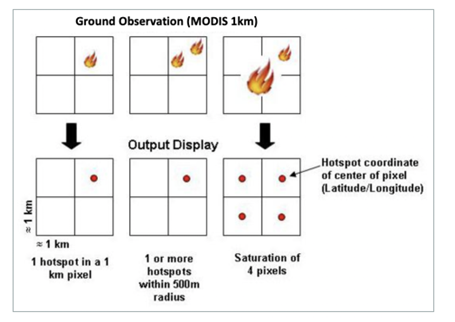
MODIS active fire detects one or more fires or other thermal anomalies (such as volcanoes) by Terra and Aqua during their overpass time. It has the ability to detect fire occurrence within 1 km. Even if multiple fires could happen at the same time within the pixel, the detection is shown at the center of the pixel, which is not necessarily the “actual” location of the fire (Figure 1). The data is provided from 2001 to current, but the mission will end in late 2026/2027.
Pros and cons: MODIS active fire contains information like detected date, time, confidence level, fire type, and fire radiative power (FRP) for you to assess the intensity of fire, and it provides data from 2001 to current. The global data is in near-real time, so you can assess the data within 3 hours of satellite observation, and for US and Canada, some AF products are available in real-time. However, the resolution is coarse (1km), so smaller fires are undetectable. Furthermore, the accuracy varies across region, where the minimum detection rate in the Middle East is 7%, and the maximum rate is 26% in Australia and New Zealand (Giglo, 2016).
VIIRS active fire
As with MODIS AF, VIIRS’s sensors- NOAA-20 (available since April 2018), NOAA-21 (available since January 2024) and S-NPP (available since January 2012), are also polar-orbiting satellites. Owing to its finer spatial resolution (750m and 375 m), and MODIS AF-derived contextual thermal anomaly algorithm, it is optimized to detect small, fragmented, and low intensity fires compared to MODIS AF. Note that the confidence value for VIIRS are determined by three levels- low, nominal, and high, which are associated with fire pixels and sun glint effect. Low confidence level pixels are associated with areas of sun glint and lower temperature anomaly, while high confidence pixels are associated with day or night-time saturated fire pixels.
Geostationary Active Fire
Geostationary active fire data addresses the gap of the overpass frequency by fixing the observation point. Positioned at an altitude approximately 45 to 50 times higher than MODIS or VIIRS, these sensors are operated by four major meteorological agencies: NOAA (GOES-16/18), EUMETSAT (Meteosat 9/11), and JAXA (Himawari-8). While these platforms provide high-frequency observations at 10–15 minute intervals, they possess a much coarser spatial resolution (2 km to 3 km), which complicates the detection of smaller fires. Currently, Geostationary data is only available in FIRMS provided from August 2022 to present, but due to the commission and omission error, the data has been filtered for better accuracy. However, as the writer tried in January 2026, the geostationary active fire data is only available through the map view, without direct data access.
- Product guide
- Data paper (validation)
There are also real-time (RT) and ultra real-time (URT) active fire available, but it only covers four areas centred with ground stations, which can be found here. The RT and URT active fire data are processed directly using the raw satellite data, where RT data is available 30-60 minutes over satellite overpass and URT can achieve it within 1 minute.
Table 1. Comparison of satellite systems for fire detection.
| Feature | Geostationary (GEO) | MODIS (Aqua/Terra) | VIIRS (S-NPP / NOAA-20) |
|---|---|---|---|
| Orbit Type | Geostationary (Fixed) | Polar (Moving) | Polar (Moving) |
| Altitude | ~35,800 km | ~700 km | ~820 km |
| Detection Frequency | Every 10–15 minutes | ~2 times per day Terra: ~10:30 AM/PM Aqua: ~1:30 PM/AM |
~2–4 times per day NOAA-20/21: ~12:40 AM S-NPP: ~1:30 AM |
| Pixel Size (Detail) | Coarse (2–3 km) | Moderate (1 km) | Fine (375 m) |
| Best For | Tracking fire growth and spread in real time | Long-term fire trends | Mapping precise fire perimeters |
What is burned area?
Burned area products are designed for providing not only where the fire happened, but also the area burned, which can be referred to as a 'burned scar'. While active fire products detect thermal anomalies (heat) at a specific moment, burned area products map the area with sudden vegetation changes due to fire in the landscape, demonstrating the spread of the fire.
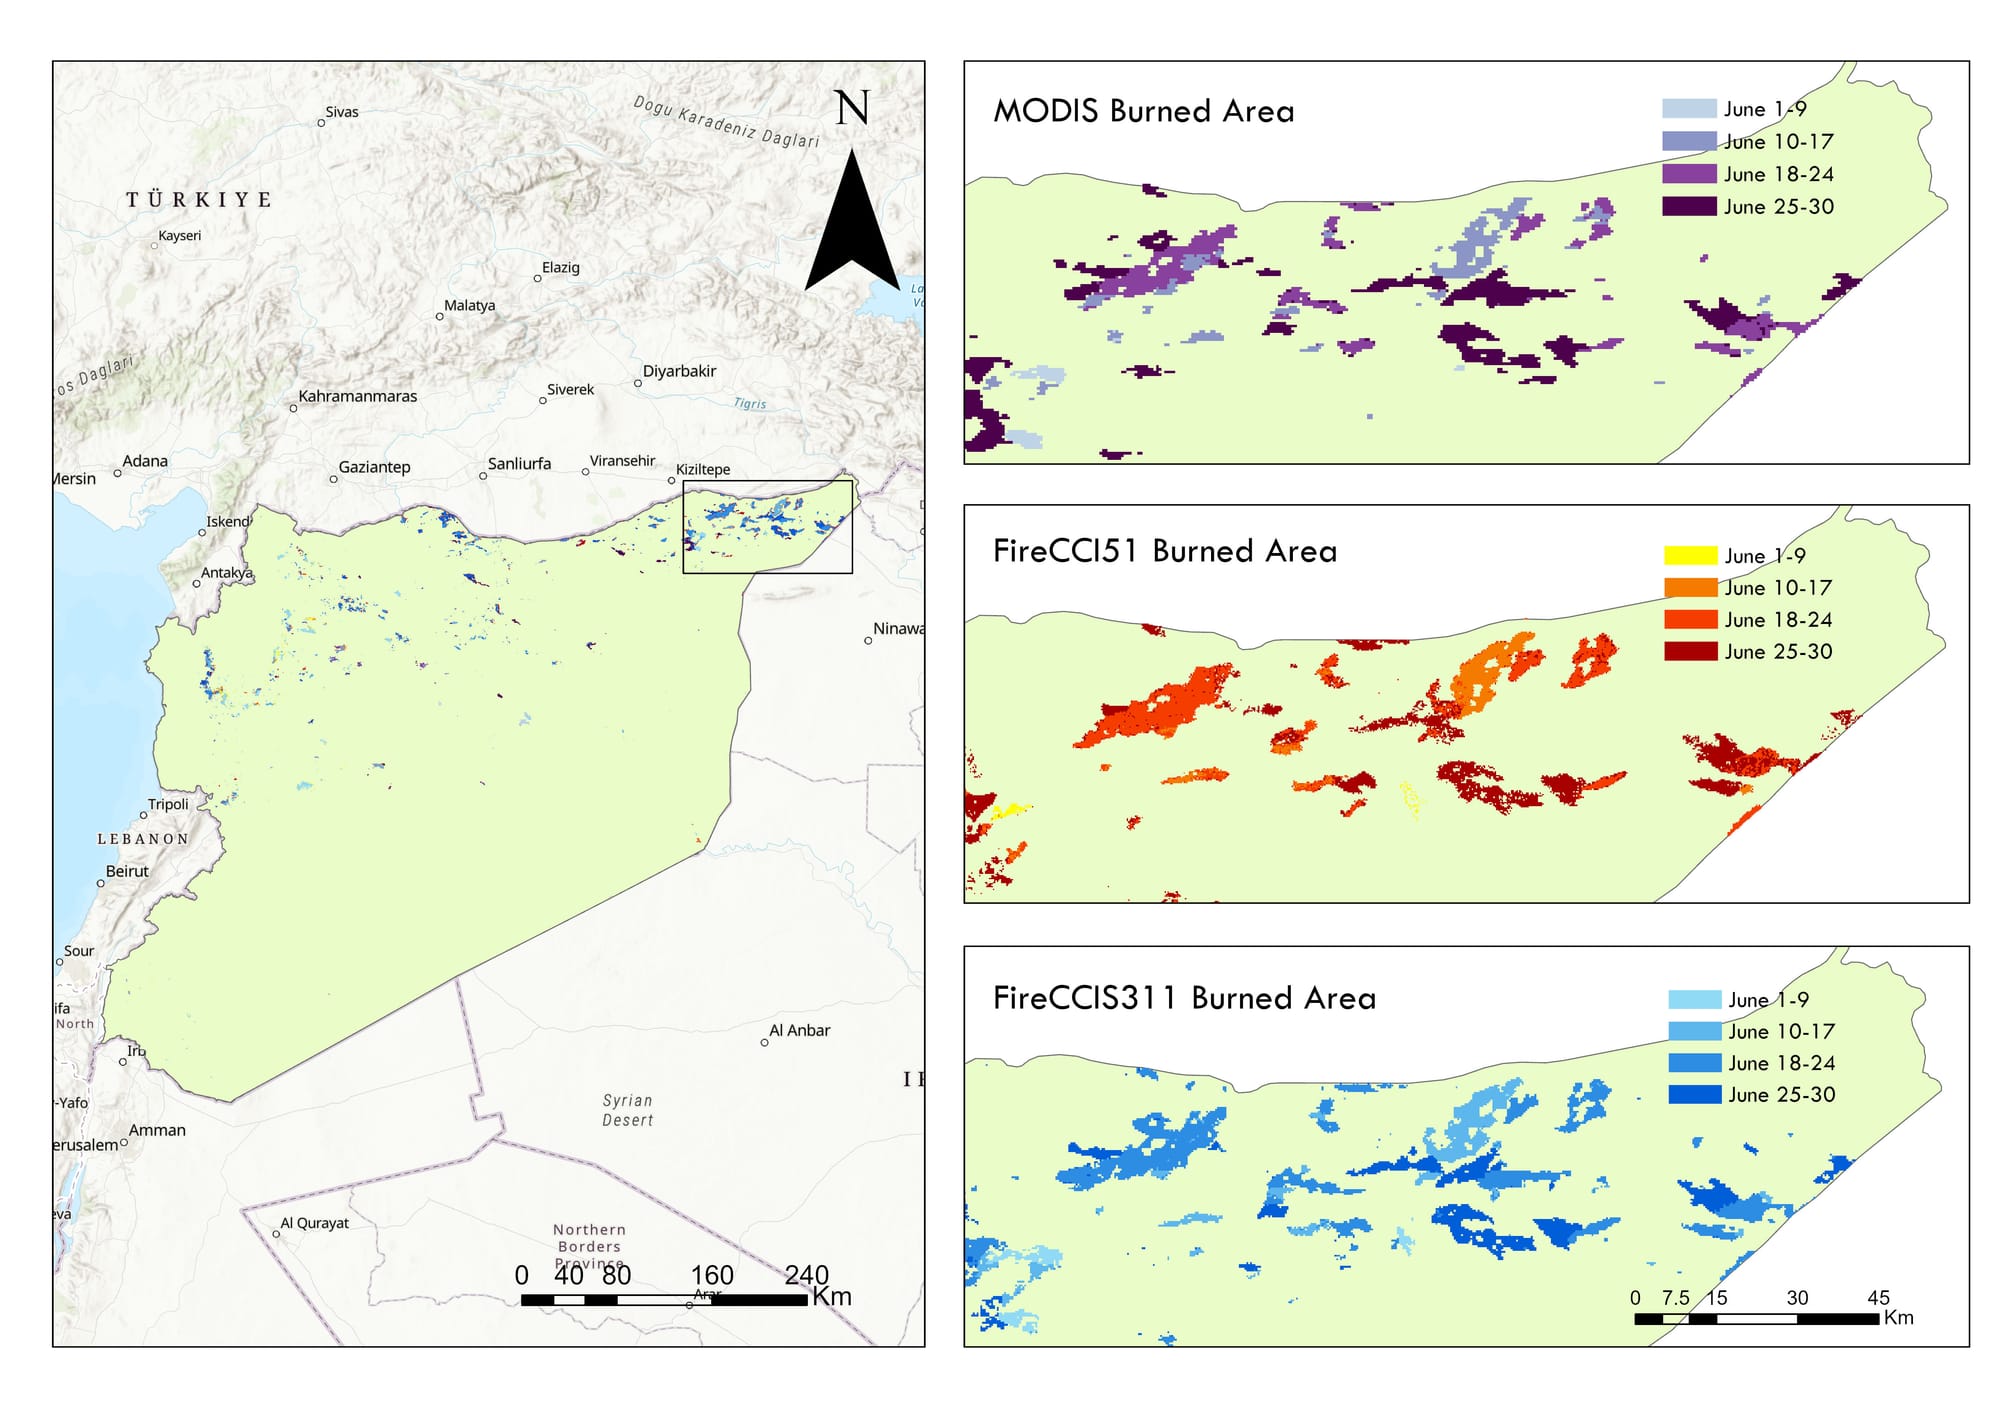
MODIS burned area
Aligned with MODIS AF data, MODIS BA (MCD64A1) collection 6.1 used 500m MODIS imagery and MODIS 1km active fire data, coupled with burned sensitive vegetation index from MODIS short-waved infrared band 5 and 7 to identify burned area. The data layers include burn data (1-366), burn date uncertainty (0-100) and quality mask. The data is available from 2001 to present. You can also download the data using Google Earth Engine.
ESA FireCCI burned area
Fire Disturbance Climate Change Initiative (FireCCI) Burned area products is a series of burned area dataset developed by European Space Agency (ESA)using MODIS AF and daily reflectance. Below, we introduce all the CCI datasets.
FireCCI51(v5.1)
This is currently one of the most widely used global fire datasets. It is based on MODIS 250m resolution imagery and MODIS active fire, and it covers the period from 2001 to 2020. Compared to MCD64A1, FireCCI includes confidence level layer and land cover layer from CCI Land cover (LC_cci v2.0.7). It is important to know that this land cover product only includes data from 1982 to 2015, so the land cover information for FireCCI51 is using data from 2015 for the year of 2017 to 2020. You can also download this data on Google Earth Engine.
FireCCILT11(Long Term v1.1)
It uses AVHRR satellite data to provide the longest available global fire history, covering from 1982 to 2018. It is developed to cover historical fire patterns. However, the spatial resolution for pixel data is 0.05° (~5 km), which is relatively coarse compared to most of the BA products.
FireCCIS311 (Sentinel-3 v1.2)
FireCCIS311 product is a recent global burned area using short and long short infrared from Sentinel-3A/3B SYN and VIIRS active fires data, coupled with global land cover data from C3S LC version2.1.1, this dataset offers a spatial resolution of 300 meters from 2019 to 2024. As this data is not available on Google Earth Engine, I downloaded the pixel-based geotiff files from the Open Data Portal at ESA Climate Office’s website.
Copernicus burned area
Built on MODIS Burned area and FireCCI burned area products, Copernicus burned area have launched a series near real time burned global burned area datasets with s special resolution of 300m, becoming the first mission to achieve this goal. Its daily global burned area products even make the data available within 24 hours after satellite overpass. The following four latest BA data are available to visualize on Copernicus EO blower. However, if you want to download the data, you might need to check out the instruction here for more information. This is the way I do: create a credential to get the access key and secret key, and I used Python to download the geotiff files.
Burned Area v3.1- CGLBA31ntc (Monthly, 2019-2025)
CGLBA31ntc and CGLBA31nrt are recent products using Sentinel-3 A and B satellites and VIIRS active fire data, with deep learning model for burned area prediction, providing 300m burned area. NTC refers to “non-time critical”, with improved accuracies but a few weeks after the data acquisition. This dataset is therefore in monthly temporal frequency. However, based on the validation in 2019 and 2020, the accuracy of this dataset shows lower accuracies compared to FireCCIS311, with large commission errors over limited regions. Also, it is important to know that the model does not take dissipation of ask and char and vegetation regrowth, which might lead to underestimation of burned area.
Burned Area v3.1 -CGLBA31nrt (Daily, Near Real-Time, 2023-2025)
Followed by CGLBA31ntc, the advantage of CGLBA31nrt is that it provides daily burned area, which is useful if you want high temporal resolution burned area data.
Burned Area v4.1 - CLMBA40ntc (Monthly, 2018-present)
Compared to the version 3, the difference is that version improves the accuracy, and provides more data layers including classification probability, burned fraction, and large fraction probability.
Burned Area v4.1 - CLMBA40nrt (Daily, Near Real-Time, 2025-present)
As similar to CGLBA31ntc , the CLMBA40nrt is the version 4 of 300m daily burned area.
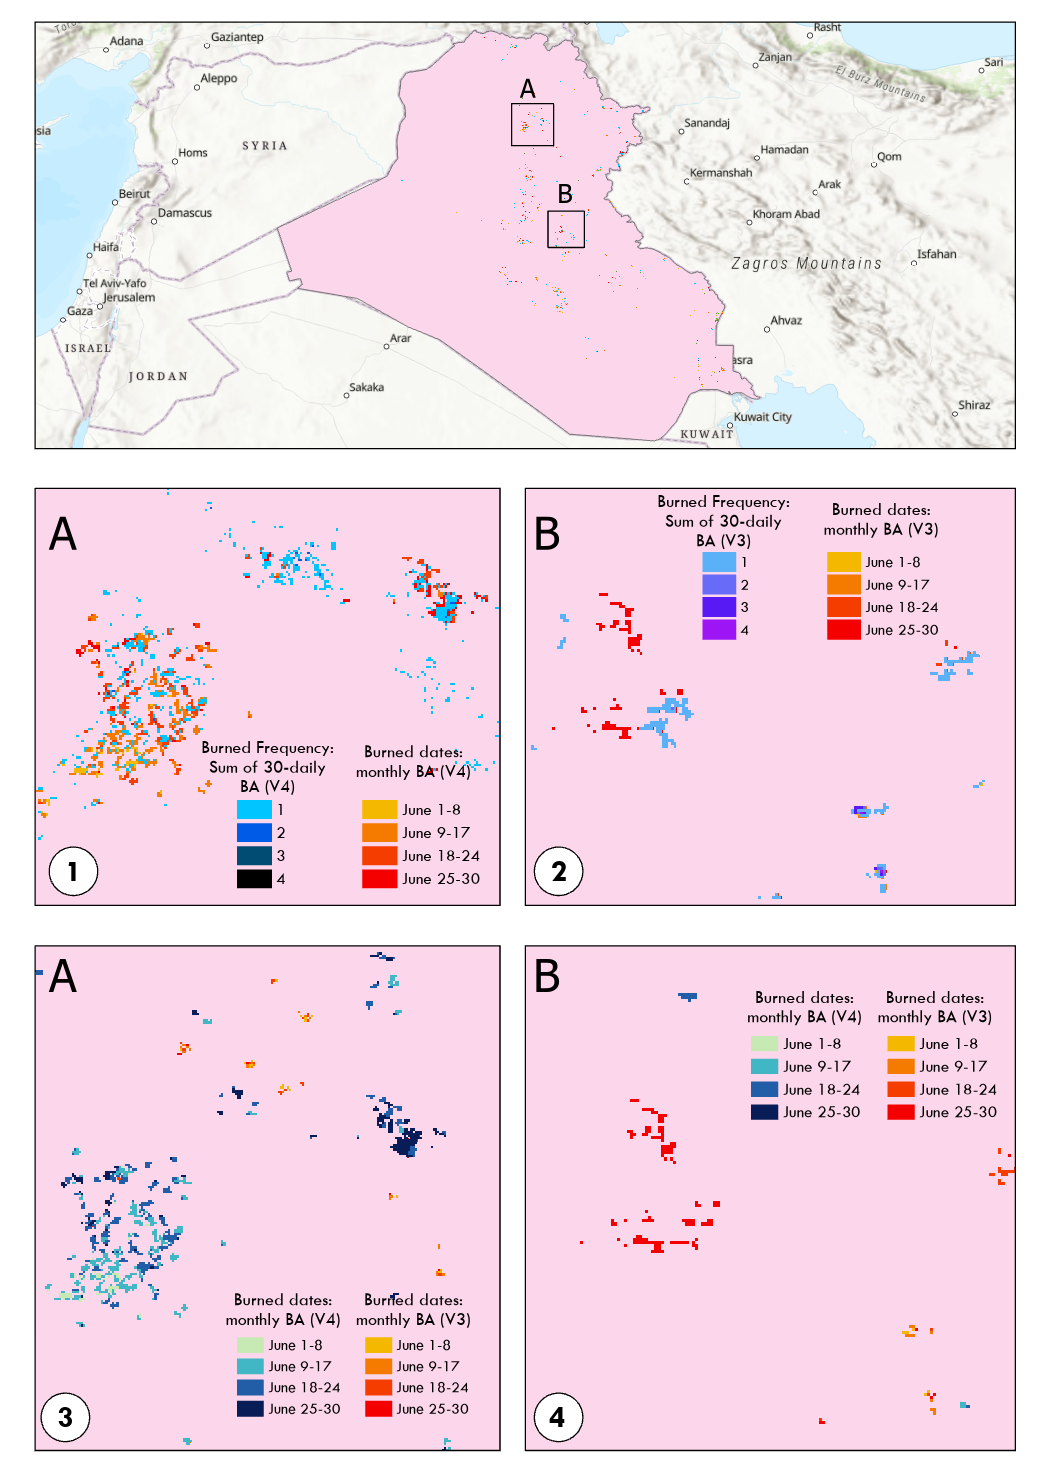
Here I want to show a map of burned area in Iraq in June, 2025, using the above four Copernicus burned area products, showing the different between different versions and different temporal resolution. I didn’t choose Syria this time because there was barely fire in June 2025 in Syria, which is also another topic to look at.
As shown at figure 3, we can see the comparison between four Copernicus BA datasets. To make the daily BA and monthly BA comparable, I summed up the 30 daily BA to calculate the burned frequency in a month using GIS. Between map 1 and 2, I compared the difference between daily and monthly products for version 4 and version 3 at subarea A and B. You can see that:
- 30-daily-sum BA data detect some small fires that monthly BA did not detect.
- Several pixels have been burned 2-4 times, showing that monthly BA missed some multiple-burned fires
Between map 3 and 4, we compare the difference between version 3 and 4 using only the monthly BA at subarea A and B, and you can see that some fires are detectable via version 3 but not version 4, and vice versa. When looking at the same month in this area, we notice that version 4 show more fire than version 3. Nevertheless, these two fire products generally show similar spatial pattern in June 2025, Iraq.
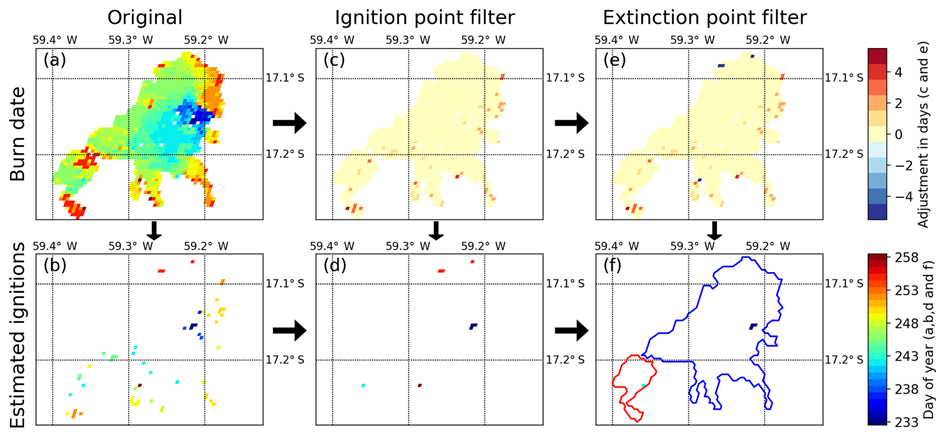
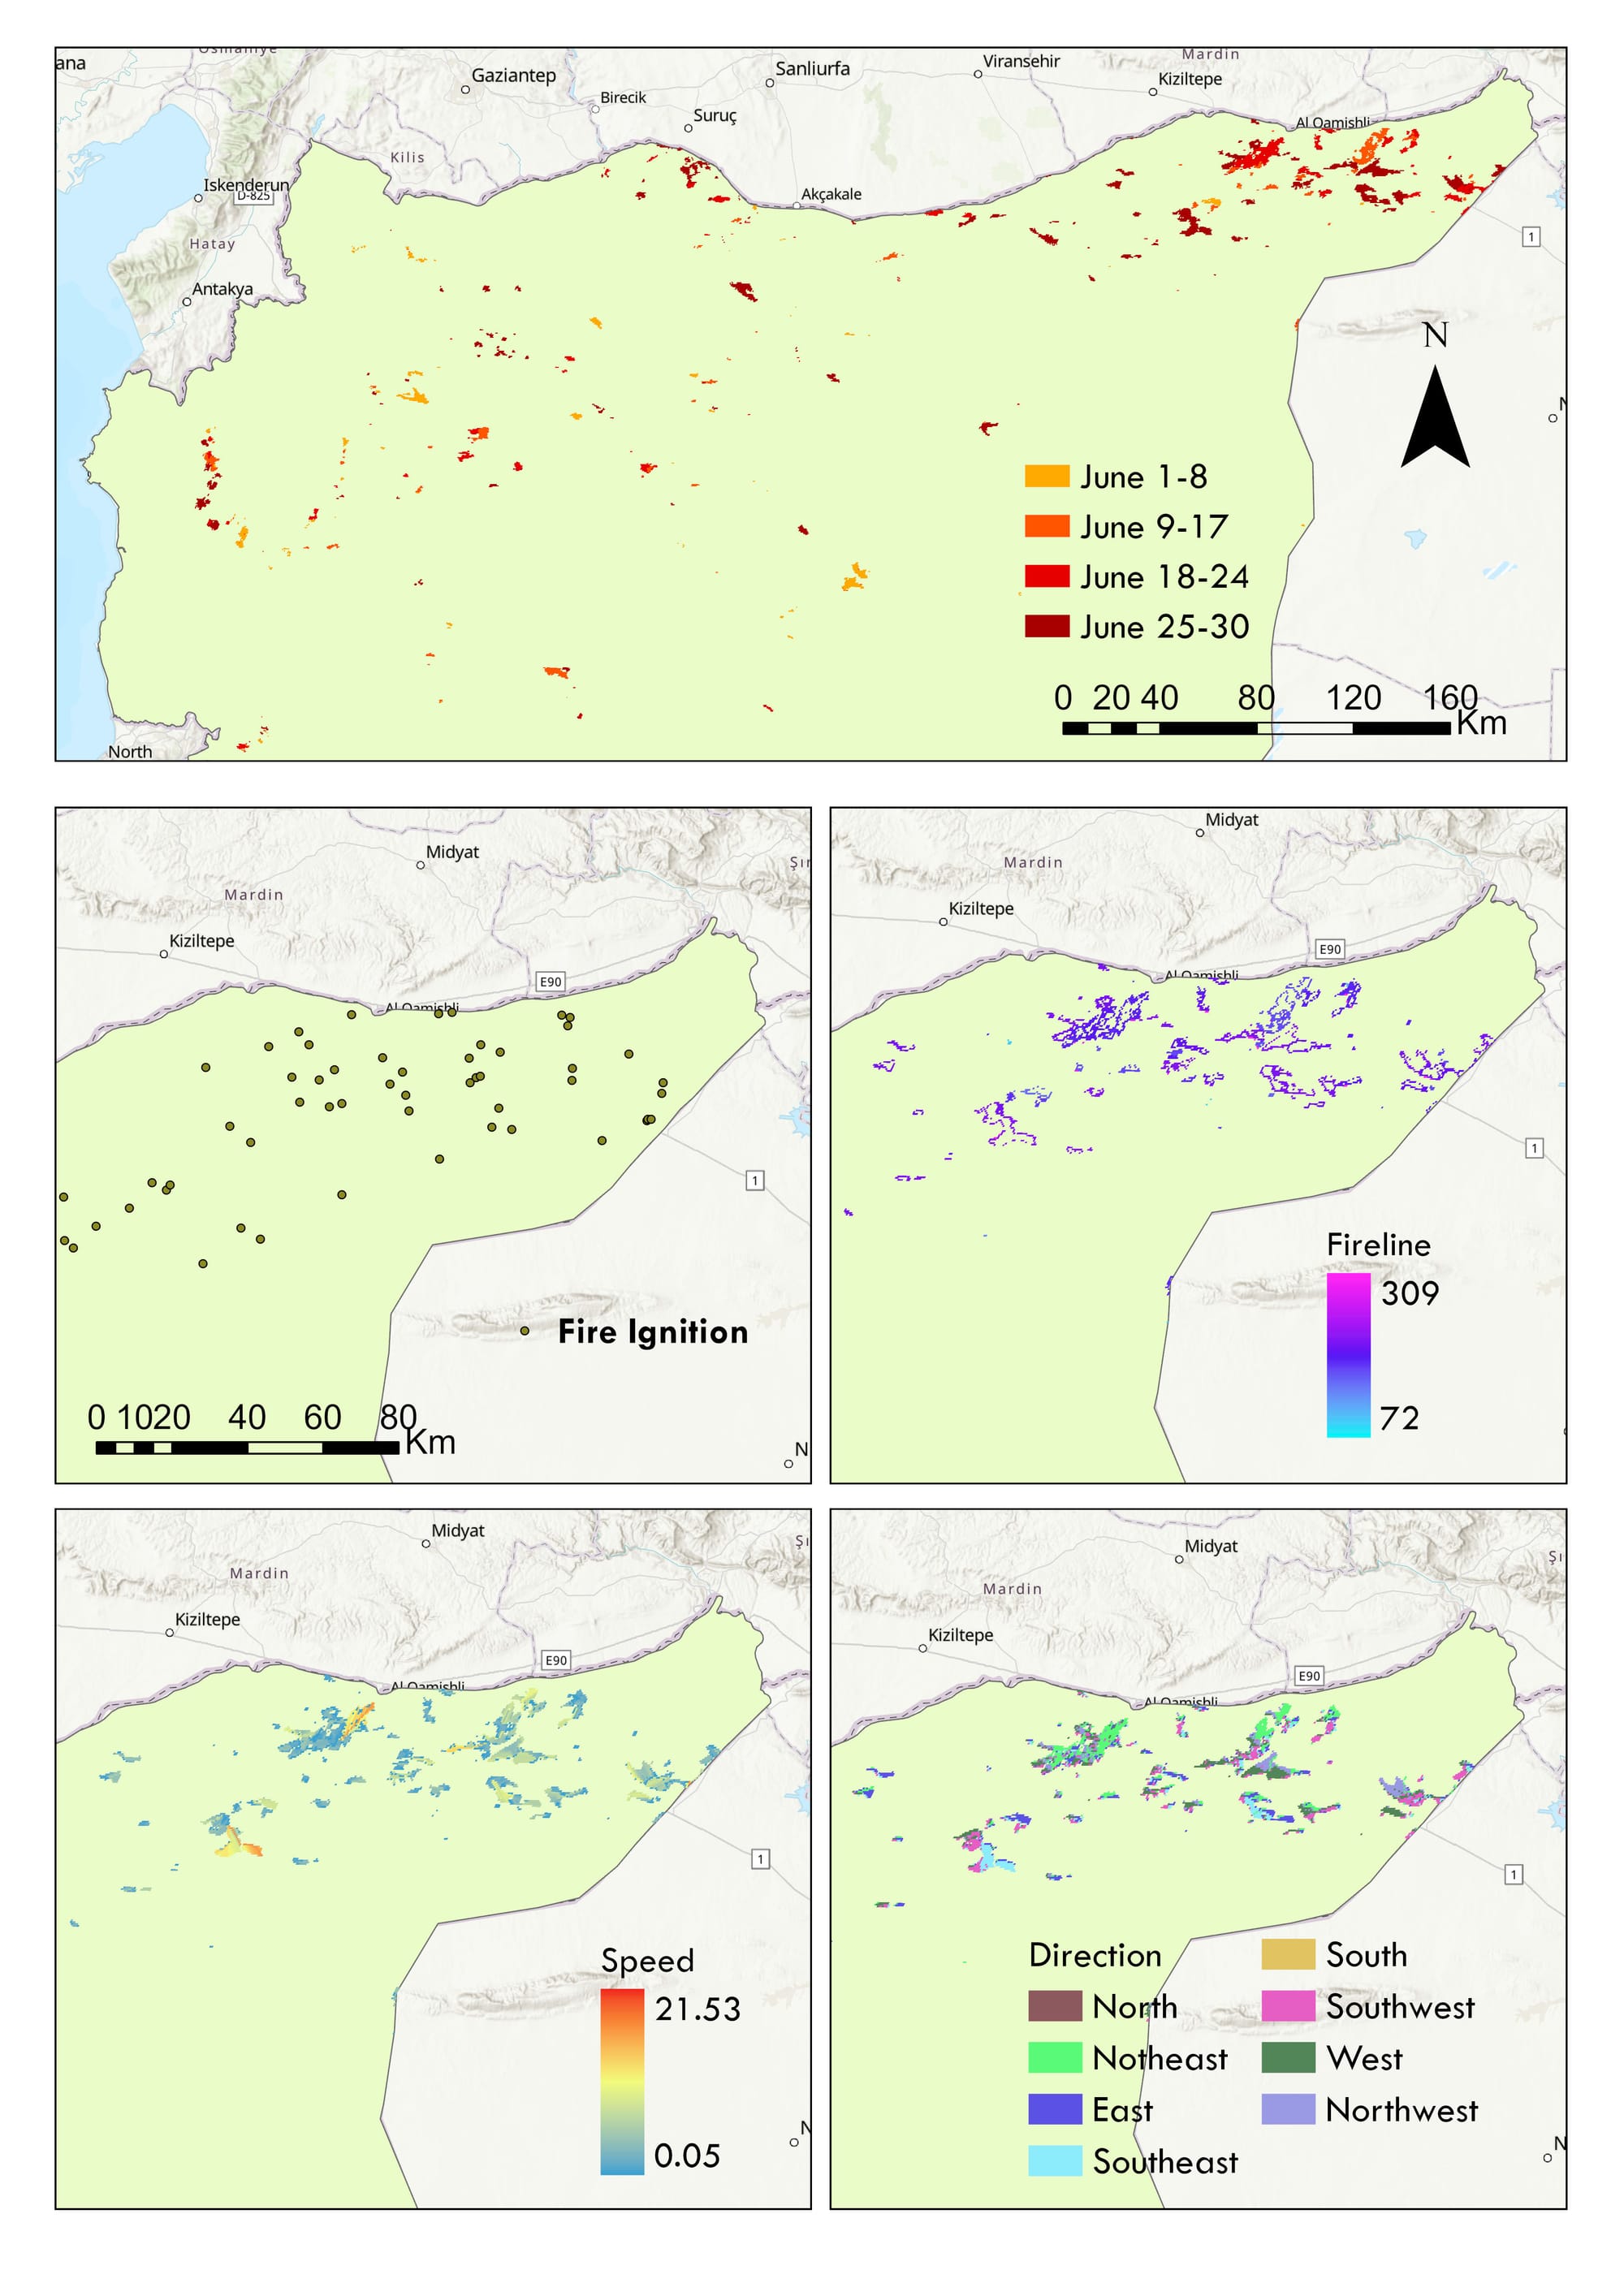
Fire Atlas
Based on 500m resolution MODIS burned area products, the Global Fire Atlas dataset addressed the gaps in distinguishing fire pixels with multiple ignition points. It traces individual fires’ timing, location of ignitions, fire size, duration, daily expansion, fire line length, speed, and direction of spread, providing individual fire behavior with both raster and vector data. This is what we can use from the Fire Atlas dataset. The data is provided from July 2003 to February 2025, with both monthly and yearly geotiff file, and annual shapefile. However, the monthly data is in 0.25-degree grid cell, and this data does not consider fire activities that happen two times a year.
The dataset includes the following files:
Table 2. Description of Fire Atlas fire variables.
| File name / Variable | Description |
|---|---|
| Day or burn | Estimated burned day, ranging from 1 to 366 |
| Fire speed | Fire spread speed (km/day) |
| Fire direction | Fire spread direction: 1 = north, 2 = northeast, 3 = east, 4 = southeast, 5 = south, 6 = southwest, 7 = west, 8 = northwest |
| Fireline | Average length of daily fire line (km) |
| Fire ignition | Point file containing ignition coordinates, ignition date, extinction day of year, fire duration, fire line, expansion, speed, direction, and land cover (derived from MCD12Q1 Collection 5.1) |
30m Global Annual Burned Area Maps (GABAM)
Landsat is not often used to developed a global fire dataset due to its limited temporal resolution, and effect from clouds, while it is more common for burned area validation. The above-mention data use Landsat or Sentinel-2 data as a validating data, but Landsat-based dataset was not developed until 2021. The Global Annual Burned Area Maps (GABAM) dataset provide a higher resolution data with 30m, and it spans from 1985 to 2021. However, the limitation of detecting cropland fires still exist, and only annual burned area data is available.
What is fire index data?
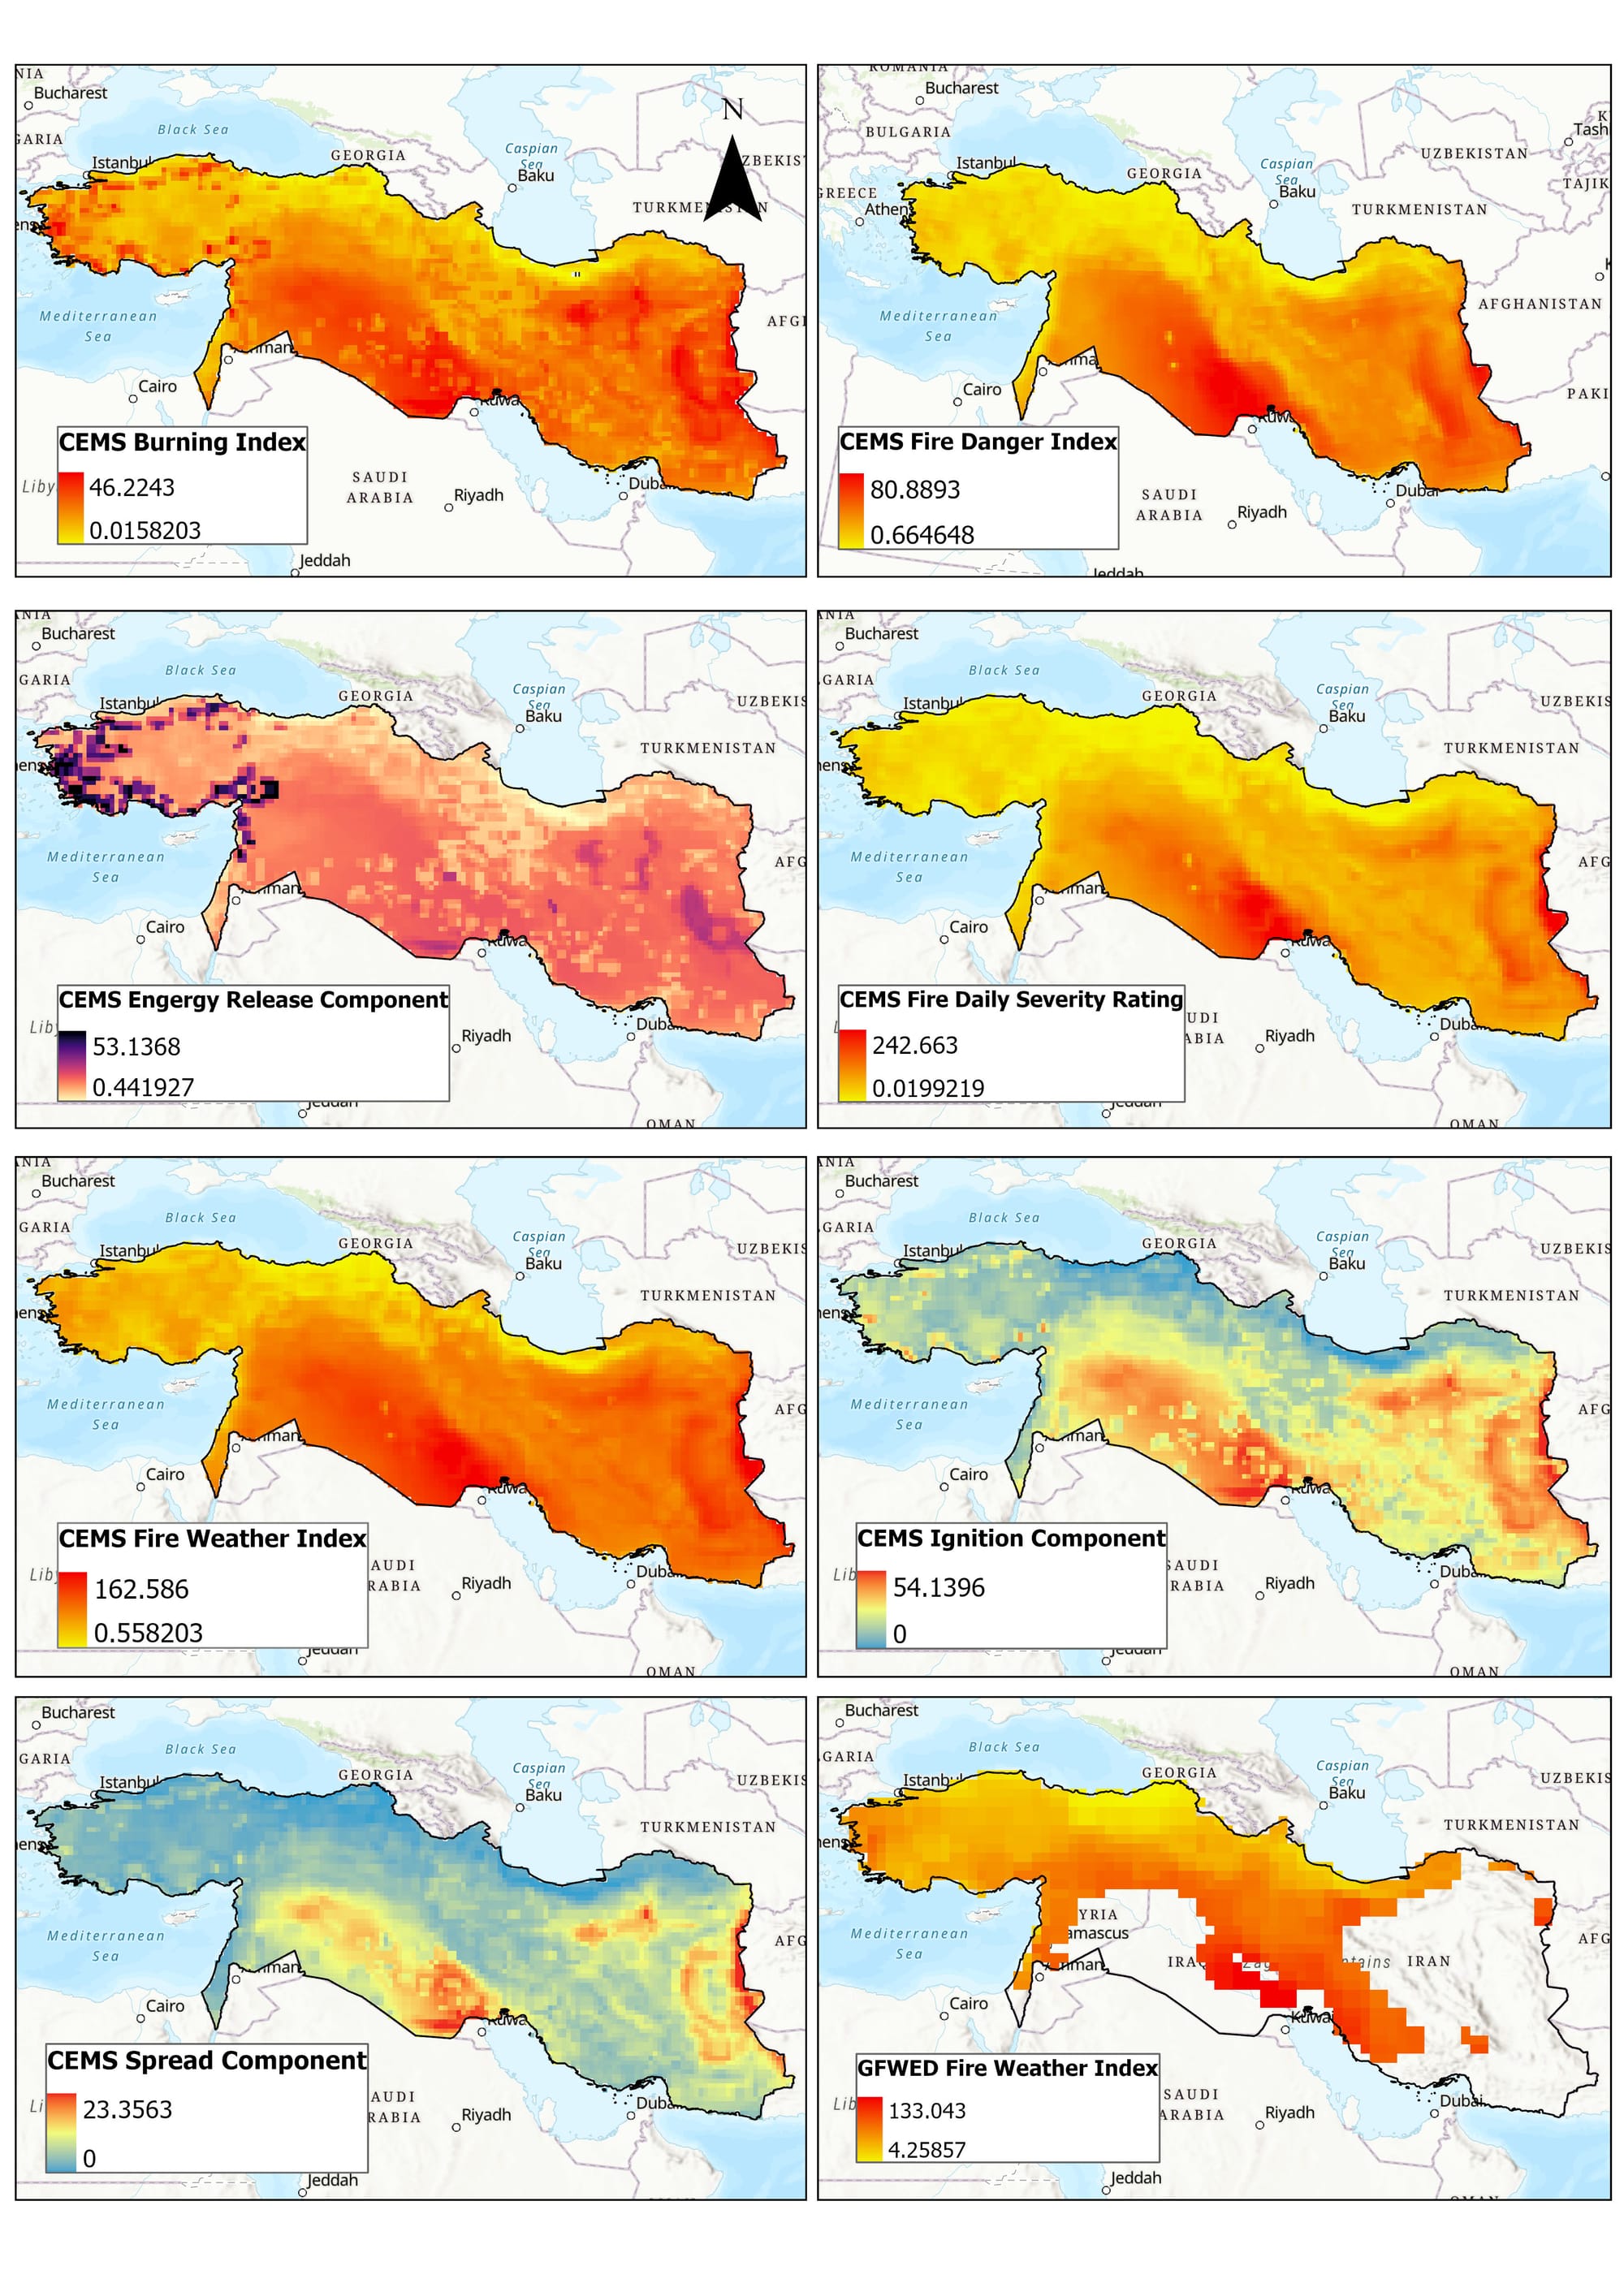
Apart from fire datasets, to assess fire risk, you can also use fire index data for fire risk prediction. The most widely used one is the Canadian Forest Fire Weather Index (FWI) System, which consists of 3 moisture codes and 3 fire behavior indices that consider both fuel moisture, availability, and weather conditions for fire risk assessment. There are also two newly developed global datasets that combine meteorological and vegetation data to evaluate fire risks, which are CEMS Fire Danger Indicies and Global Fire WEather Database (GFWED), and they are both accessible via Google Earth Engine.
CEMS Fire Danger Indices
This datasets is developed from the European Centre for Medium-Range Weather Forecasts (ECMWF), using simulated weather data from ERA5 reanalysis. These datasets are available from 1940 to present, with daily, 0.25 degree (25km) spatial resolution, consists of the following 14 components.
Table 3. Description of fire weather and fire danger indices from CEMS Fire Danger Indicies
| Variable | Description |
|---|---|
| Fine Fuel Moisture Code (FFMC) | Measures moisture in surface litter and small twigs (< 1 cm). Highly reactive to hourly weather; scale 0–99. |
| Duff Moisture Code (DMC) | Measures moisture in loosely compacted organic layers (5–10 cm deep). Affected by rain and temperature, not wind; ~12-day time lag. |
| Drought Code (DC) | Indicates moisture in deep, compact organic layers (10–20 cm deep). Very slow-reacting with a ~52-day time lag; maximum value ~800. |
| Keetch–Byram Drought Index (KBDI) | Measures net moisture deficiency in deep duff and upper soil layers. Scale ranges from 0 (saturated) to 200 (maximum drought). |
| Build-up Index (BUI) | Weighted combination of DMC and DC representing the total fuel available for combustion; primarily used for pre-suppression planning. |
| Drought Factor | Index ranging from 0 to 10 representing how recent rainfall and temperature affect fuel availability; often derived from KBDI. |
| Energy Release Component (ERC) | Cumulative index of available energy (BTU per square foot). Reflects drought conditions by tracking moisture in all live and dead fuels. |
| Initial Fire Spread Index (ISI) | Combines FFMC and wind speed to estimate the potential rate of fire spread. |
| Spread Component | Numerical prediction of headfire spread rate (feet per minute); treated as a dimensionless index with an open-ended scale. |
| Ignition Component | Probability (0–100%) that a firebrand will ignite a fire requiring suppression action. |
| Burning Index | Combines fire spread and energy release to indicate fire control difficulty; closely related to flame length. |
| Fire Weather Index (FWI) | Combines ISI and BUI to estimate potential frontal fire intensity; commonly used for public fire danger warnings. |
| Fire Danger Index | Broad indicator of ignition probability, spread rate, and suppression difficulty; values above 50 are typically classified as extreme. |
| Fire Daily Severity Rating | Exponential transformation of FWI representing the actual physical effort required for fire suppression. |
Global Fire WEather Database (GFWED)
This databased is developed by NASA, and it is based on the FWI system, but calibrate with weather station data from different countries, providing 0.5-0.65 degree (~50km) daily data from 1980 to present.
Other fire related data?
Apart from fire datasets, fire index datasets, there are also many other relevant datasets to assess fire regime based on your interest. The following datasets might provide you more information on the effect of fire.
1. Fire emission data: Fire emission data quantify the chemical species and mass of pollutants released during combustion. They are vital for atmospheric chemistry modelling and health impact assessments.
- Global Fire Emissions Database (GFED)
- Global Fire Assimilation System (GFAS)
- Fire INventory from NCAR (FINN)
- QFED (Quick Fire Emissions Dataset)
2. Aerosol data: Aerosol datasets measure the physical particles (smoke, soot, dust) suspended in the atmosphere. They are used to track smoke plumes and assess climate forcing.
- Aerosol Optical Depth (AOD)
- TROPOMI (Sentinel-5P)
- OMPS Aerosol Index
- Lidar Vertical Profiles (CALIOP/CALIPSO)
To sum up all the fire products I mentioned, the table below summarizes all the properties of different kind of fire products, and this can help you have a better overview of them.
Table 4. Overview of global active fire, burned area, and fire-related climate datasets
| Data name | Data type | Time period | Temporal resolution | Spatial resolution | Satellites / Source |
|---|---|---|---|---|---|
| MODIS Active Fire (AF) | Point | 2001–present | Near real time | 1 km | MODIS Aqua and Terra |
| VIIRS Active Fire (AF) | Point | 2012–present | Near real time | 375 m / 700 m | Suomi NPP and NOAAA-20 |
| Geostationary Active Fire | Point | 2000–present (availability varies by sensor) | Sub-hourly (10–15 min) | 2–3 km | GOES, Meteosat, Himawari |
| MODIS Burned Area (MCD64A1) | Raster | 2001–present | Daily / Monthly | 500 m | MODIS Terra and Aqua |
| FireCCI51 Burned Area | Raster | 2001–2020 | Monthly | 250 m | MODIS Terra and Aqua |
| FireCCILT11 | Raster | 1982–2018 | Monthly | 0.05° (~5 km) | AVHRR |
| FireCCIS311 | Raster | 2019–2024 | Monthly | 300 m | Sentinel-3 |
| CGLBA31ntc | Raster | 2019–2025 | Monthly (NTC*) | 300 m | Sentinel-3 |
| CGLBA31nrt | Raster | 2023–2025 | Daily (NRT*) | 300 m | Sentinel-3 |
| CLMBA40ntc | Raster | 2018–present | Monthly (NTC*) | 300 m | Sentinel-3 |
| CLMBA40nrt | Raster | 2015–present | Daily (NRT*) | 300 m | Sentinel-3 |
| Fire Atlas | Raster / Point | 2003–2025 | Daily | 500 m | MODIS |
| GABAM | Raster | 1985–2021 | Annual | 30 m | Landsat 7 and 8 |
| CEMS Indices | Raster | 1940–present | Daily | 0.25° | ERA5 (reanalysis) |
| GFWED Indices | Raster | 1980–present | Daily | 0.5° | MERRA-2 (NASA) |
| NTC = Non–Time Critical; NRT = Near Real Time. |
At this post, I tried to list out most of the global available fire datasets that are commonly used. Choosing a fire dataset is primarily determined by where you want to study? When you want to study? What is the spatial and temporal scope? What kind of data do you want? This post unfortunately hasn’t yet provided a comprehensive information about the validation of the datasets, as it varies across different regions. Features such as sun exposure, longitude, vegetation types will affect the performance of fire detection. Nevertheless, I hope this post can help you to choose the fire datasets you want.